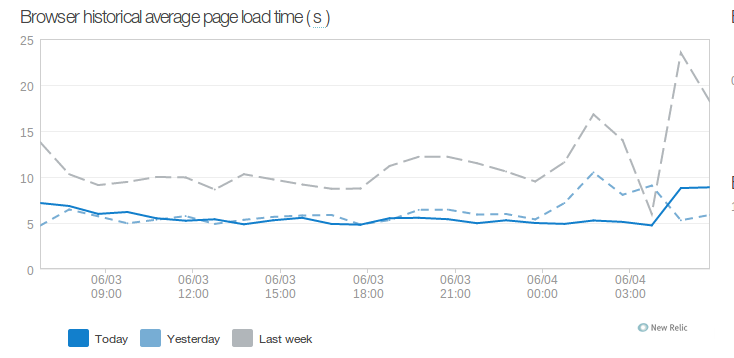
Spent about a week working on optimizing performance of
WordPress-based web application. While site already had
some optimizations in place, like W3 Total Cache backed by
APC and mod_pagespeed installed, there still were complaints
that site loads very slow.
Before making any action I started by measuring actual performance and gathered metrics using New Relic and Chrome Developer Tools Audit Tab. New Relic showed a few of critical insights into performance troubles.
First one was two widgets in the footer of every page each making requests to external API services taking on average ~600ms one and ~1500 ms another. As the second service was our own custom service I quickly optimized it by adding counter cache field to table instead of making select on depended records on each request and request time went down to around ~150 ms. But these requests were still made on every page load so I patched both widgets to cache responses from external API in memcached for 5 minutes. Average page generation time went down to around ~800 ms.
Another thing to optimize was W3 Total Cache. First I turned off its minify
option as it was sometimes taking up 2-3 seconds according to New Relic. Next I
switched cache storage from APC to memcached as APC
was constantly reset every minute by some rogue code somewhere on this server:
grep -r apc_clear_cache showed about hundred of matches. This issue also
affected PHP opcode caching so I decided to switch to Zend OPcache
for opcode caching. For page cache I choose to switch from memcached storage
to extended disk so if page was cached then Apache would serve it directly
without hitting any PHP code. As database queries were taking
insignificant percentage of all page generation time I switched DB cache
completely off to avoid PHP overhead and instead cranked up MySQL
own query cache memory limits.
With all these optimizations page generation time stabilized around ~600ms against ~2500 ms week ago and I called it a day - I don’t think I can squeeze more performance out of WordPress without going through analyzing performance impact of each plugin.
The next step in the site optimization was tuning of mod_pagespeed settings.
At first it looked like it was not working at all. After checking
mod_pagespeed logs I have found that it doesn’t work with SSL by default and
we have https-only site. Another obstacle with which I have spent good half
hour is that W3 Total Cache page cache interferes with mod_pagespeed, looks
like later ignores static HTML files. After that I have enabled most of
mod_pagespeed CoreFilters, focusing on CSS and JS files optimization, as we
had about 30-40 assets of each kind, and was able to reduce number of external
CSS/JS down to 9-10 per page. I have also tried to optimize page loading by
using filter defer_javascript which moves JS files down to page footer but
had to turn it off later as it broke some JS navigation menus. Overall page
load speed went down from around 10 seconds to 5 seconds on average.
